


Visualising India’s Heat Challenge in 10 Images
Extreme heat is more than an environmental issue – it is a public health crisis, a development hurdle and a matter of basic equity. Conversations around heat often fixate on maximum daytime temperatures, but heat stress is shaped by much more than a single parameter.
Heat is deeply multi-dimensional. Its characteristics, how we measure it, and its impacts vary drastically across different sectors and socioeconomic groups. That’s why we launched #HeatLensIndia — an outreach campaign combining maps, spatial analysis and storytelling to reveal how heat is truly experienced across different scales, geographies and communities.
1. Going Beyond the Red
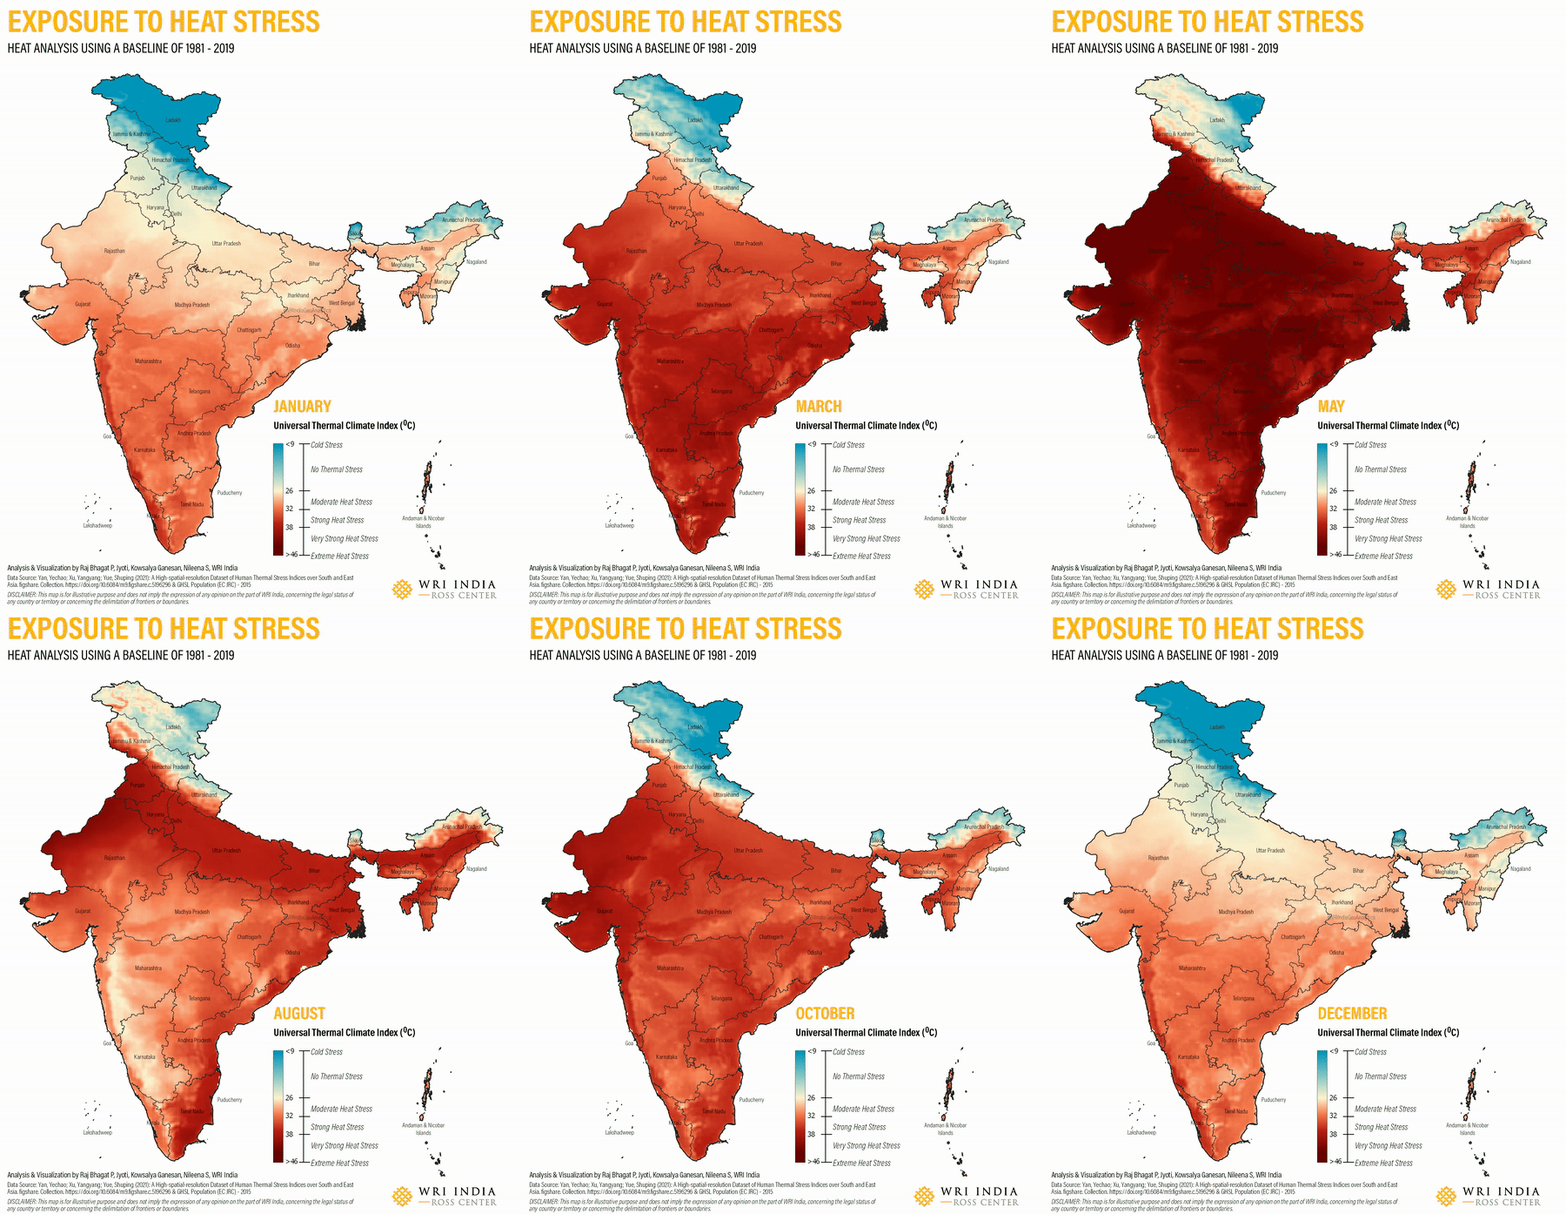
Long-term climatological data across India from 1981 to 2019 reveals a deeply entrenched crisis: an estimated 108 crore people endure "very strong" heat stress for over 100 days every single year. The map below features a colour gradient to represent heat-stress intensity, with darker shades representing increasingly severe conditions. Moving beyond the familiar reds, the full spectrum highlights heat stress and its shifting intensity week-by-week to show you how this crisis unfolds across the seasons.
2. Why Real-Feel Temperatures Matter?
Air temperature is the most frequently reported metric, but environmental factors drastically alter how heat is experienced: high humidity can make moderate temperatures feel oppressive, while wind speed can worsen discomfort through scorching gusts or offer relief via evaporative cooling.
While no index can perfectly fit every geography or sector, the Universal Thermal Climate Index (UTCI) framework offers a reliable measure for human health by factoring in temperature, humidity, wind and solar radiation to capture actual physical distress.

Can you measure and map a heatwave?
3. Why Cities Feel Warmer than Neighbouring Rural Areas?
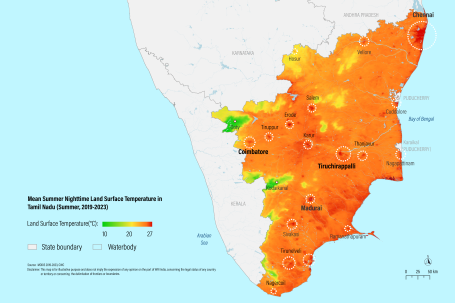
India’s urban agglomerations consistently experience higher temperatures than their rural counterpart — a phenomenon known as the Urban Heat Island (UHI) effect. Concrete structures and asphalt roads absorb vast amounts of solar radiation during the day, trap heat and radiate it back out at night. The loss of natural ecosystems and the constant heat generated by human activities further compound the effect. This stark temperature divide between cities and the countryside is vividly captured in this nighttime land surface temperature map below.
4. Why Are Cities Not Cooling at Night?
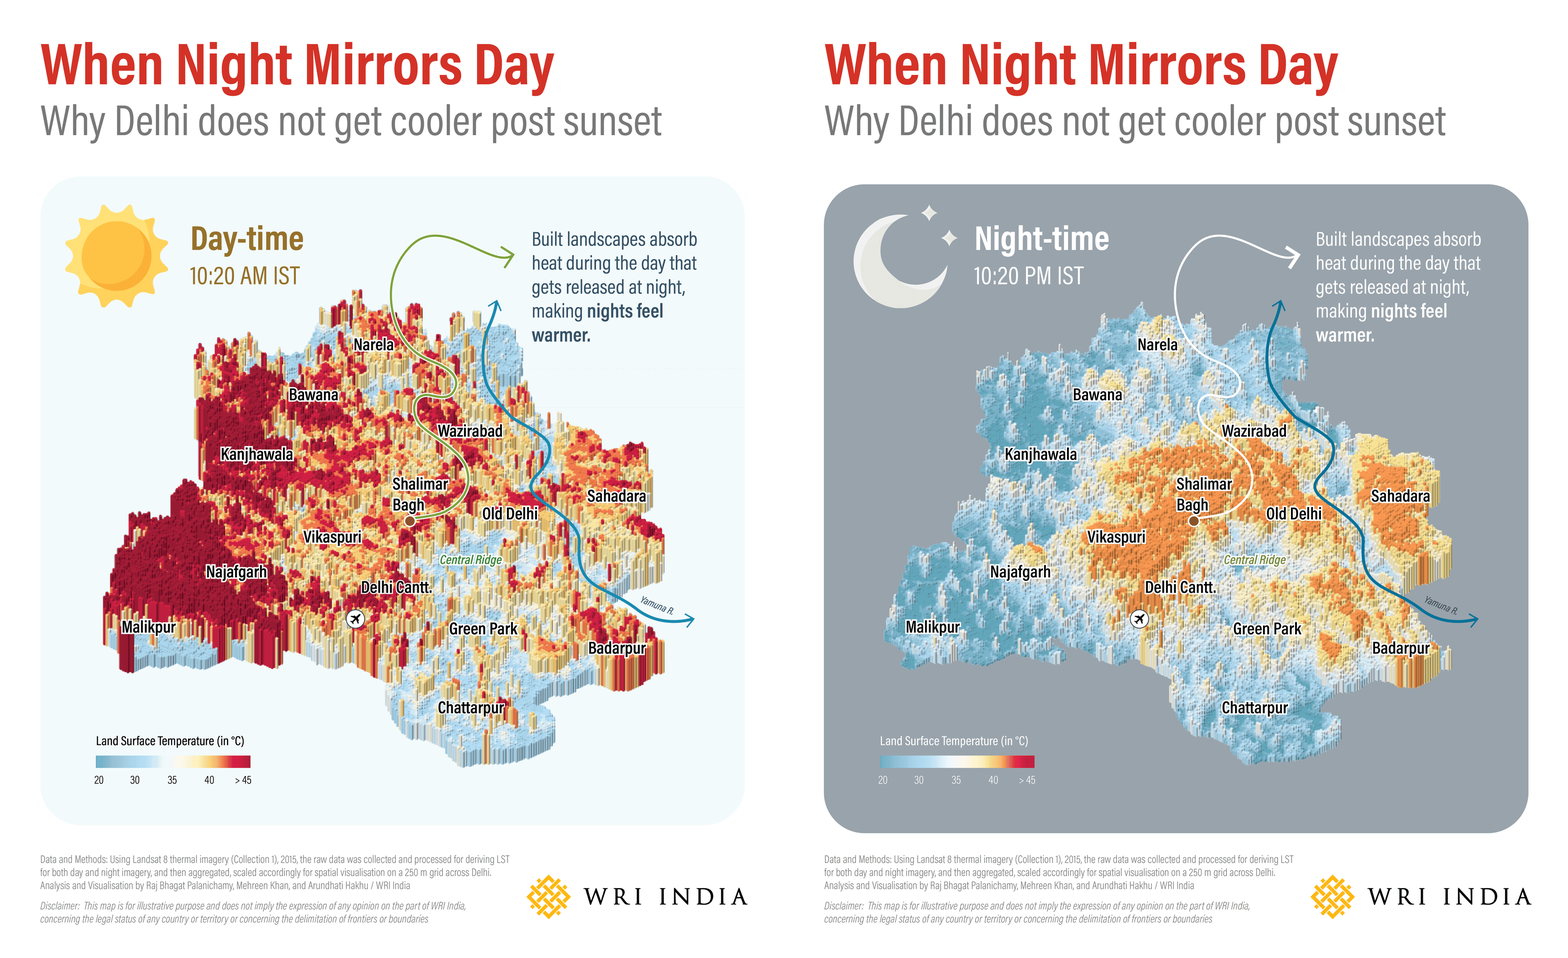
Delhi just recorded its warmest May night since 2012, with minimum temperatures refusing to drop below 32.4°C — nearly 6°C above the seasonal average. The city's highest nighttime temperature in almost 14 years illustrates a dangerous trend: urban clusters across India are no longer cooling down after sunset. Our cities are continuously storing, trapping, re-radiating and generating heat, turning what used to be a daytime hazard into a round-the-clock crisis.
5. Should Different Regions Measure Heat Differently?
Geography dictates how heat is experienced, and different geographical contexts require different metrics to address the impacts of heat. Inland cities like Delhi endure punishing daytime heat, but a high diurnal temperature variation exists where the stress at night is comparatively less. In contrast, coastal cities like Chennai rarely experience the same extreme temperature peaks due to the ocean's moderating influence, but the relentless humidity limits nighttime cooling, trapping residents in persistent heat stress.
6. Why Heat Doesn't Feel the Same Across a City?
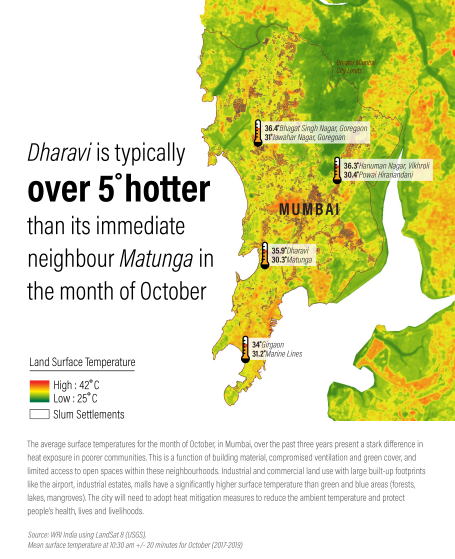
Due to localised differences in urban form, vegetation, land use, construction materials and human activity, temperatures can vary significantly even within a city. With ambient air temperature being measured across a limited number of weather stations, Land Surface Temperature (LST) serves as a proxy, capturing the actual “skin temperature” of the urban environment — i.e. roads, rooftops, pavements, vegetation and water bodies. Though it has its limitations, mapping LST can help understand specific localised hotspots and differential exposure across neighbourhoods, and support targeted urban planning and heat resilience interventions.
7. How Does Indoor Humid Heat Impacts Workers?
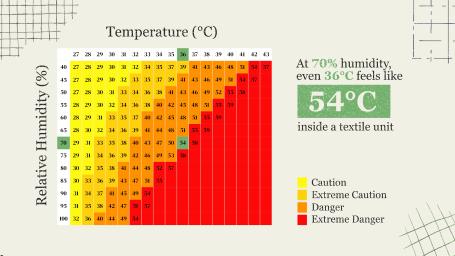
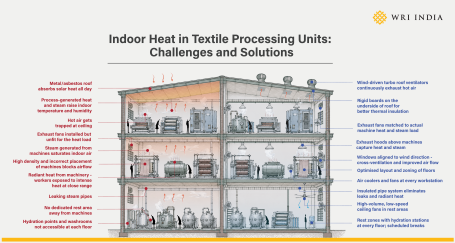
When we talk about heat, we often think of the outdoors. But for many workers in India’s textile MSMEs, the real challenge lies inside the factory. Temperatures on the shopfloor can cross 40°C. Add high humidity, and it can feel over 55°C. High humidity makes it harder for sweat to evaporate, reducing the body’s ability to cool itself and increasing the risk of heat-related illnesses. Long hours in poorly ventilated, heat-intensive spaces make this an everyday risk to health, safety and productivity.
Watch: How indoor heat affect workers
MSME workers in textile units talk about their experience of heat in this video.
8. What is the Impact of Heat on Incomes?
For the 36.5 crore people working across India’s 8.21 crore MSMEs, work during the summer months is a daily trade-off between health and income. Workers push through heat, illness and fatigue because missing a day means losing income. For women workers, it is even worse as they limit water intake in the absence of hygienic sanitation facilities, thereby putting them at risk of dehydration and urinary tract infections. Gig workers, such as delivery drivers, not only face the brunt of extreme heat but also report instances of phones that stop working in the heat, resulting in lost income.
9. What is Systemic Cooling Poverty and Why Does it Matter?
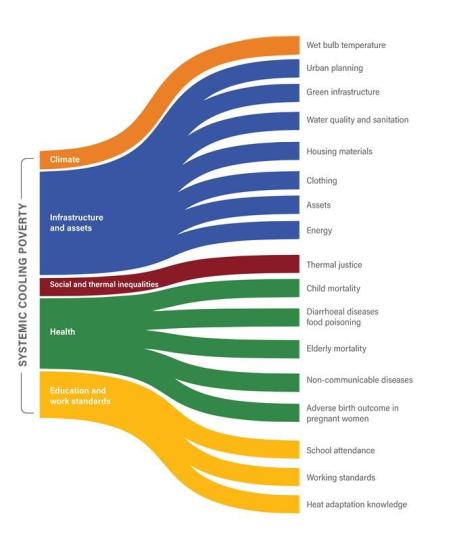
Systemic cooling poverty refers to the lack of access to the infrastructure, services and resources needed to stay safe and comfortable during extreme heat. It goes beyond the absence of fans and air-conditioners and includes inadequate housing, limited access to shade and ventilation, unsafe commuting conditions, and insufficient cooling facilities in workplaces, schools and public spaces. This ‘systemic cooling poverty’ impacts the health, livelihood, safety and overall quality of life for millions of Indians.
10. How Real-Time Monitoring of Heat Can Improve Lives?
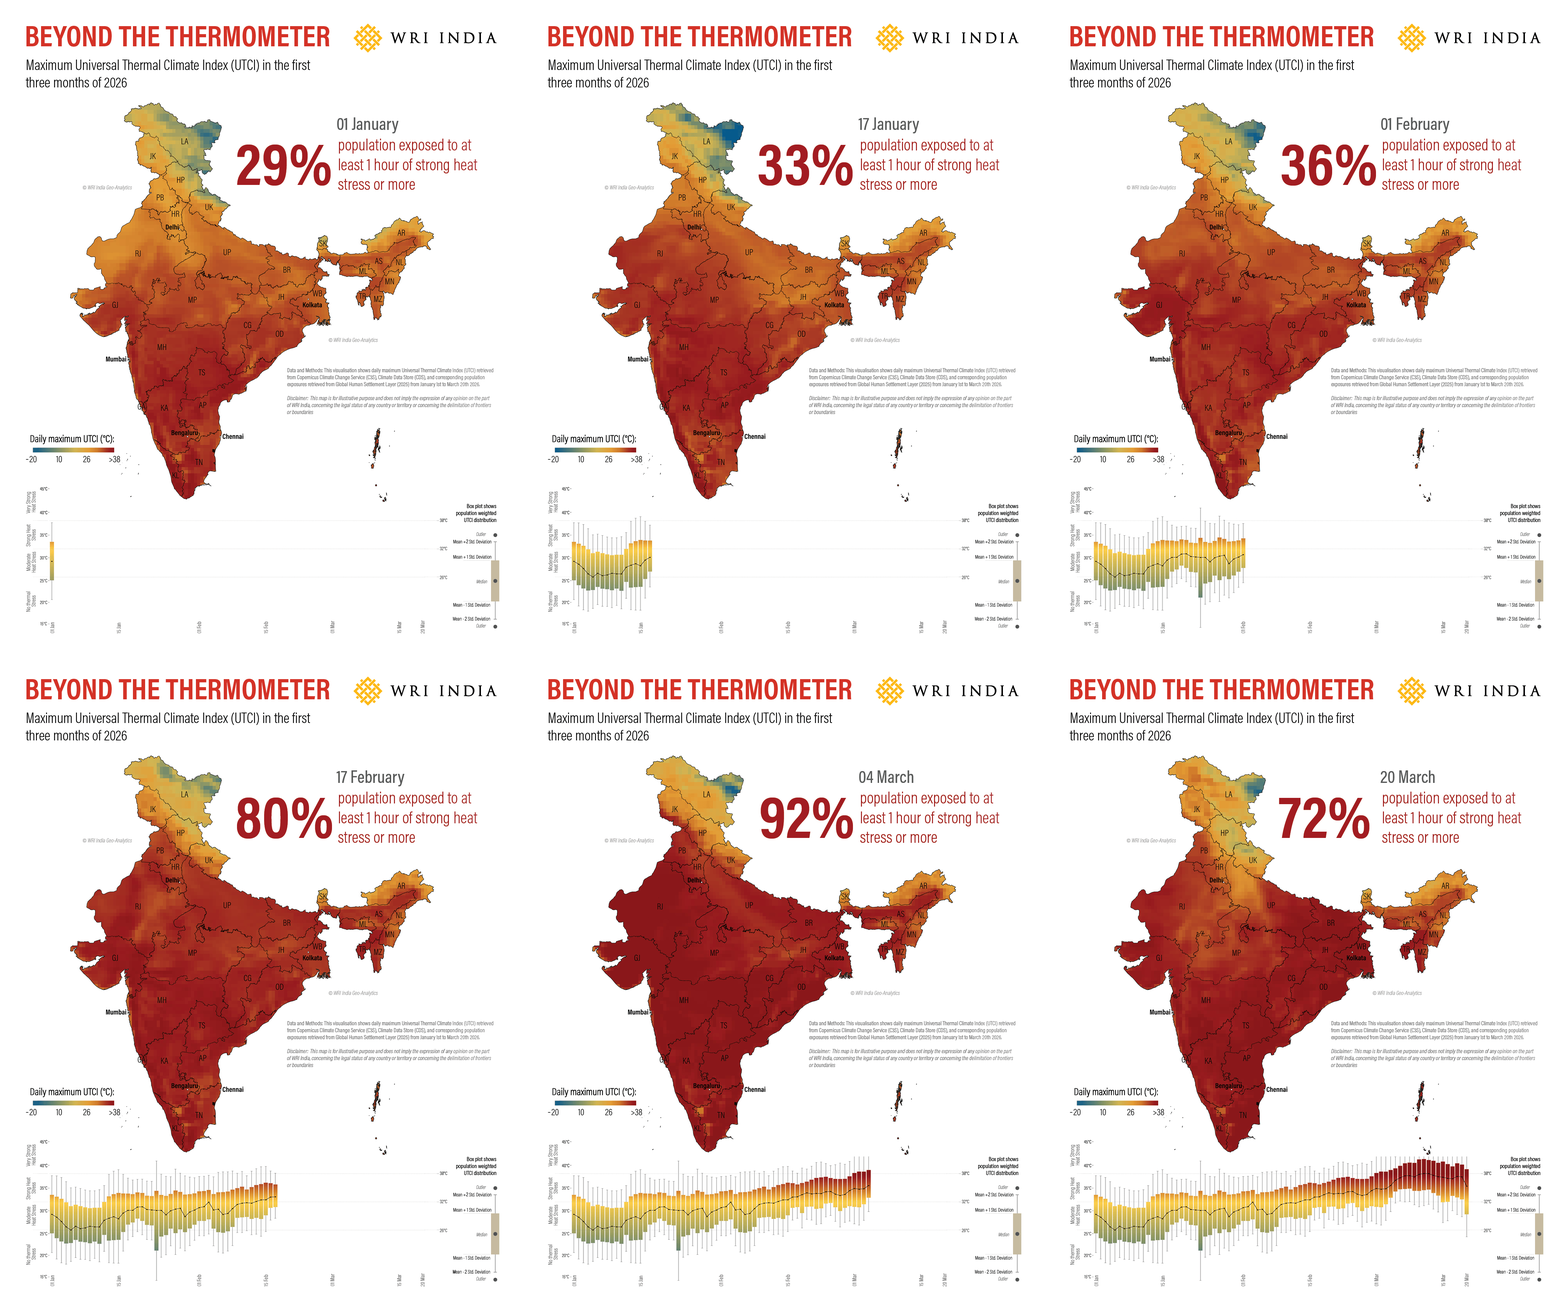
Moving beyond static, long-term climatology reports, heat stress must be monitored in real time to support timely action and reduce risk. To better protect lives and livelihoods, sector-specific heat metrics need to be integrated directly into daily operational decisions and weather forecasts. This animation tracks the daily progression of the Universal Thermal Climate Index (UTCI) across India in just the first three months of 2026.
At its core, #HeatLensIndia is an effort to change how we see heat beyond isolated summer peaks and the summer months. As per an Oxford University report, if the world reaches 2.0°C of global warming above pre-industrial levels, the number of people living in extremely hot regions globally is likely to double — from about 1.5 billion today to nearly 3.8 billion in 2050. The study also warns that "most of the impacts will be felt early on as the world passes the 1.5°C target set by the Paris Agreement.”
As temperatures rise and urbanisation accelerates, the challenge ahead is not simply to respond to extreme heat events but to prepare for them by redesigning our systems, spaces, workforce and infrastructure to withstand a warmer future.