


How Does a City Move? Six Indicators for Understanding Urban Mobility
It is 8:30 am on a weekday as you sit in traffic, watching the minutes tick by on your phone. The vehicles around you are barely moving. The journey to work that should take 30 minutes is already stretching to an hour. When you finally arrive, you are met with the question, “Did you get stuck in traffic?”
This is how we often talk about urban mobility. We look at the traffic and how long it takes to get from one place to another. Cities around the world are compared by the same measure every year; however, congestion tells us only one part of the story.
A city can have fast-moving traffic and still pose difficulties for people trying to reach workplaces, schools and services. A neighbourhood can have plenty of roads but poor connectivity between them. Despite having access to public transport, people may have to travel long distances every day. If congestion is the question we ask, congestion is the problem we will see. Urban mobility is much more than traffic and congestion. It is about how people access opportunities, how they travel, how far they need to go, how reliably they can get there, and whether they can do so safely and sustainably.
To understand how a city's transport system is performing, we need to look at a broader set of indicators that reveal how the system works together. Much like an economic system, a city's transport system is shaped by the interplay of demand (how many are travelling, how far they travel, what is the purpose, what mode is being used) and supply (private vehicles, public transport, road network). Understanding its performance therefore requires looking at the interplay of demand and supply of transport infrastructure and services.
Based on our research, we have identified six key indicators to assess this: road networks, speed, modal share, average trip length, electrification and road safety. The recently launched Transport Analytics Hub (TAH) by the SHIFT Transport Initiative brings together analytics and visualisations across 30 Indian and global cities, enabling users to explore these six indicators and build a more comprehensive picture of how cities move.
1. Modal share: How are people moving?
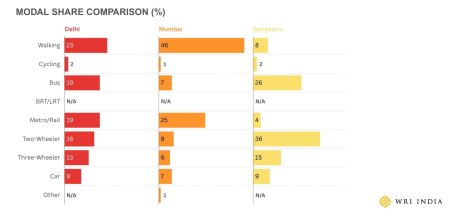
Modal share tells us more than how people currently travel. It can point to where cities need to focus their efforts. For instance, if private vehicles account for a large share of daily trips in an area, strengthening public transport and making it a more convenient, reliable and attractive alternative can help shift trips towards more sustainable mobility.
TAH enables cities to compare modal patterns across different urban contexts, helping identify relative strengths, gaps and opportunities for improvement. Rather than suggesting that every city should have the same modal split, these comparisons can help cities understand where they stand, learn from others, identify where strengthening public transport could have the greatest impact and set pathways for where they aspire to be.
2. Average trip length: How far do people need to travel?
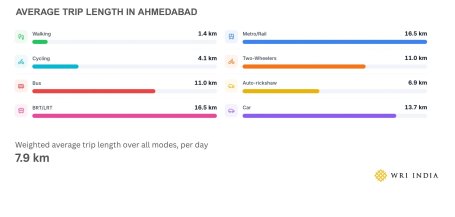
Average trip length refers to the distance travelled by a person per trip within a city. It influences mode choice, overall travel time and indicates how long travellers occupy and share public infrastructure with others.
TAH provides average trip length by mode across different cities, offering valuable insights into travel behaviour, city growth and network structure. It can also help estimate the total distance travelled by different modes, assess related emissions, fuel consumption, and other impacts on the environment and the transport system.
Typically, as cities grow, average trip lengths, particularly for motorized modes, tend to increase. Planning approaches such as densification along transit corridors and mixed-use development try to reduce average trip lengths by bringing jobs closer to where people live.
3. Road networks: How well are places connected?
A city does not function through a handful of wider roads. It functions through a hierarchy of roads – arterial roads carrying longer-distance traffic, primary and secondary roads distributing this traffic, and local streets providing access to individual properties. Each layer of this hierarchy plays a critical role, and its physical design should complement that role.
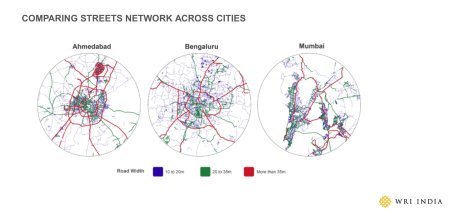
Additionally, road networks take years to build. The biggest obstacle is often not engineering but land acquisition. Acquiring land after a city has already developed around a corridor is expensive, politically challenging and disruptive. Thus, road network planning needs a 10-to-15-year horizon. As cities continue to strengthen mass transport options like metro, building connected secondary networks becomes crucial for strengthening last-mile connectivity.
Imagine two neighbourhoods separated by just a few kilometres. On a map, they appear close, but in the absence of a direct road or public transport option, the actual journey between them can take longer.
This distinction matters because the response to congestion could easily focus on the symptom rather than the cause. We could widen the congested road or add a flyover, without addressing why so many trips are being funnelled through that particular corridor in the first place.
4. Speed: How long do the trips take?
Speed is one of the most familiar measures of congestion, commonly assessed by comparing peak-hour speeds with free-flow speeds to understand the extent of traffic slowdowns. However, looking only at speed data can hide an important part of the story: how travel conditions change throughout the day.
Even if two cities have similar average speeds, a city where speeds remain relatively consistent throughout the day may offer more predictable journeys, as opposed to one where speeds fall sharply during peak hours.
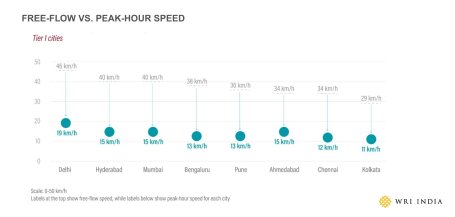
TAH shows how travel speeds vary considerably across Indian cities. During peak hours, large metros can lose up to two-thirds of their travel speed — Bengaluru drops from 38 km/h at 3 AM to 13 km/h at 7 PM and Chennai from 34 to 12 km/h. A 20-minute trip becomes a 45-minute trip. This reduces the area people can reach within the same travel time — limiting access to jobs, services, education, and daily opportunities.
5. Road safety: Can everyone move safely?
Road safety constitutes a global crisis, with people losing their lives or facing severe injuries every single day. Citizens are usually blamed for a crash, but this approach fails to assess if the road design is safe to begin with. Humans are bound to make mistakes, but the cost should not be their lives.
Designing safer systems that shift accountability from individuals to decision-makers, engineers and stakeholders involved in designing roads has proven to make roads safer for all users. In lieu of this, TAH also offers a safety analysis.
6. Electrification: How is the transport system changing?
The transport sector contributes 13.5% of India’s energy-related emissions — road transport alone accounts for 87% of this. As India advances toward its net-zero goal for 2070, electric mobility is a critical pathway for decarbonising the transport sector, strengthening energy security and fostering economic resilience. TAH enables users to track electrification through vehicle ownership, fleet size, and EV adoption indicators across cities.
For decades, urban transport has been referred to in terms of traffic volumes and vehicle speeds. However, moving vehicles faster does not necessarily mean people can access jobs, schools, healthcare or other opportunities more easily. There is a difference between measuring traffic and understanding mobility. The latter can only be achieved by looking at multiple indicators together.
Data becomes useful not when it gives us one definitive answer, but when it helps us identify the question we were not asking. We must move from asking how we can reduce traffic to focusing on why people are travelling the way they do and what would make their journeys easier, safer and more efficient.
With inputs from Avinash Dubedi.