

Beyond the Dashboard: Three Steps to Democratising Data
WRI India has long used geospatial analysis, open-data platforms and evidence-based modelling to make complex urban, climate and energy challenges easier to understand. By revealing patterns, generating actionable insights and making evidence more accessible, our work has been supporting data-informed decision-making for more than 15 years now.
Data is essential to understanding the challenges we face and how best to address them. While interactive tools are a great way to make data accessible, a tool is only valuable if it is used. Even the most sophisticated tool risks remaining unused if it doesn’t solve a real problem, address a user need, or integrate seamlessly into an existing workflow.
This year at our annual convening, Connect Karo 2026, alongside conversations, roundtables and panels, visitors encountered something a little different – WRI India Data Lab Unboxed. The lab aimed to demystify data complexities and get visitors to engage closely with our tools and platforms. This resulted in an immersive experience that allowed people to get hands-on experience of 19 tools and view their impact in a curated exhibition.
In keeping with the theme “Unboxed,” this picture blog unpacks what it takes to make data tools accessible to all.
1. Design for Curiosity and Conversation
“How do we make engaging with data complexities an inviting experience?”
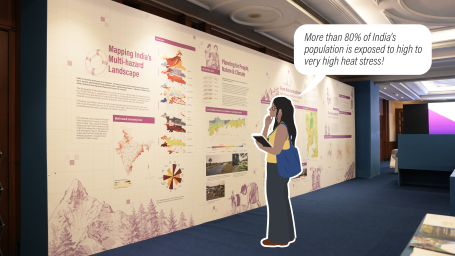
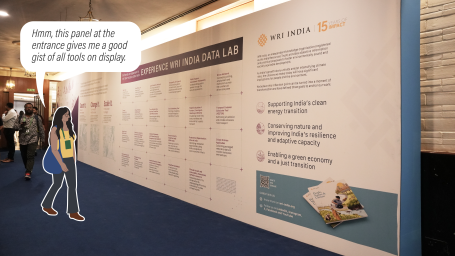
Presenting complex information in accessible ways can help people connect with the issues that impact their lives and understand how best to address them. While simplifying the information was key, we also focused on how people explore and experience it spatially. This approach led to an informal design space that invited people to engage, absorb or simply follow their curiosity at their own pace. Steering clear of elevated stages, panels or roundtables, the data lab featured an amphitheatre-style seating on one side. In the other half, exhibition panels were stationed with demo stations in between, encouraging people to linger and converse.
“When you see a number, it doesn’t mean anything but being visualised like this really makes us understand it. What I liked is you could interact with the maps and layers of information. For instance, I could really visualise high density corridors and carbon footprint of the food we waste.”
- Sanchi Bhardwaj, Co-Founder Crossed Design
2. Engineer for Engagement
“How do we make technical tools accessible for all?
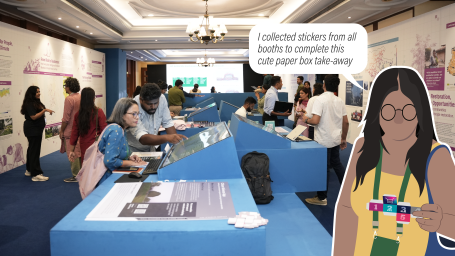
From understanding energy demand and exploring transport systems to mapping hazards and identifying restoration opportunities, our open access tools offer different ways of looking at India's urban development, climate and environmental challenges. To simplify the objectives, capabilities and usage of the tools, we relied on a visually rich format with brief text cues in the form of flipbooks for each station. We also added an element of gamification to encourage users to try multiple tools. Visitors received a sticker at each demo station to craft a keepsake – a small box, in keeping with the Unboxed theme.
“This lab is inspiring and gives me ideas for my thesis. The way the tools have been developed is fascinating. I like the tool on nature-based solutions financing and how it creates a pathway for design.”
- Janani, Student, Masters in Advanced Urban Planning and Data Analytics
3. Go Beyond the Build: Learn from Users
“We spend so much time and effort on research, but is this work being translated into actionable insights?”
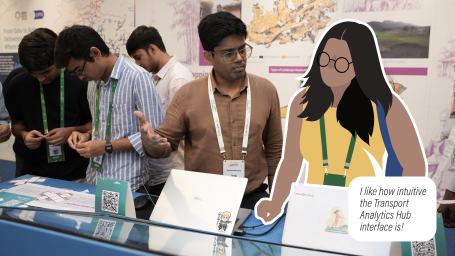
Meeting users and understanding what they look for in tools was critical for us. While much of our time is spent on researching, designing and developing tools, we don’t often get the opportunity to hear directly from the people who use them.
This experience helped us break out of our own box and listen to researchers looking for the right data, civil society organisations (CSOs) exploring citizen science applications, and students eager to connect with sectoral experts. These conversations gave us a clearer understanding of what users need, what works for them and where our tools can do better.
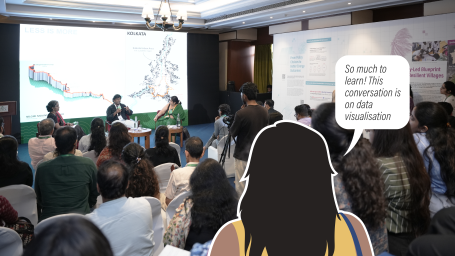
At the end of the day, the impact of a data tool lies beyond the technology. It’s about research, design, storytelling, collaboration and ultimately, the people who bring its purpose to life. As we move towards creating more such experiences, our goal isn’t simply to build better – it’s to ensure what we build is relevant, useful and likely to be used by those it is supposed to inform.
Thank you to Arundhati Hakhu, Abhishek Venkitaraman and Ankita Rajeshwari for their input. Photos by WRI India and illustrations by Arundhati Hakhu.